Shared VPS Dedicated WP Enthusiast WP Professional WP Professional Plus
My site seems unusually slow or difficult to reach.
We will gladly assist you in identifying possible network problems reaching our service. Although we cannot control network performance outside of our own network, we may be able to address the matter through our backbone providers or advise you on who to contact.
Before submitting any report, please run a traceroute. Once completed, send the results to us, as well as your computer's IP address so we can perform a trace out to you. If the problems seem to recur at a particular time of day, please log in to your account and run a traceroute back to your own IP address, and provide a copy of that output, as well.
To determine your computer's IP address, visit http://ipadd.info, and it will display your computer's IP address for you.
What is a traceroute?
A traceroute is an internet application that details the path from a client machine (your computer) to a specific host computer. It displays the time it takes to travel to the destination computer as well as a description of the "hops," or the jumps to a network router or gateway, along the path. Traceroutes are useful tools to help diagnose network problems.
How do I run traceroute?
The process of running traceroute will differ depending on your operating system. Find your operating system type below:
Windows
The Windows operating system also includes a traceroute application called tracert (used from the MS-DOS command line). While traceroute is available on all recent versions of Windows, there are some differences between the different versions. Because of this, it's important to find the correct version before attempting the tutorial.
To run traceroute on Windows 10, follow these steps: Be sure to replace [IP address or website address] with an IP address or web address to your domain. For example, if you were to use a traceroute on pair.com, the command would look like:
tracert [IP address or website address]
tracert pair.com
To run traceroute on Windows 8, follow these steps: Be sure to replace [IP address or website address] with an IP address or web address to your domain. For example, if you were to use a traceroute on pair.com, the command would look like:
tracert [IP address or website address]
tracert pair.com
To run traceroute on Windows 7, follow these steps:
- Click the Start icon orb in the left bottom corner of the screen
- In the search field, enter Command Prompt
- Click Command Prompt in the search results
- In Command Prompt, enter the following command and press Enter:
tracert [IP address or website address]
Be sure to replace [IP address or website address] with an IP address or web address to your domain. For example, if you were to use a traceroute on pair.com, the command would look like:
tracert pair.com
To run traceroute on Windows XP and Windows Vista, follow these steps:
- Click Start in the bottom left corner of the screen
- Click All Programs, then click Accessories
- Click Command Prompt
- In the Command Prompt window, enter the following command and press Enter:
tracert [IP address or website address]
Be sure to replace [IP address or website address] with an IP address or web address to your domain. For example, if you were to use a traceroute on pair.com, the command would look like:
tracert pair.com
Mac
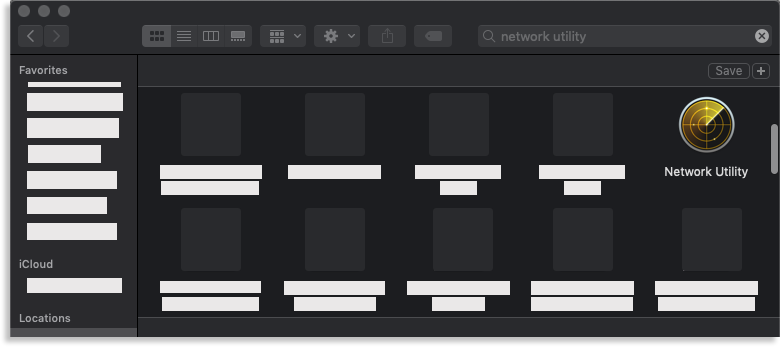
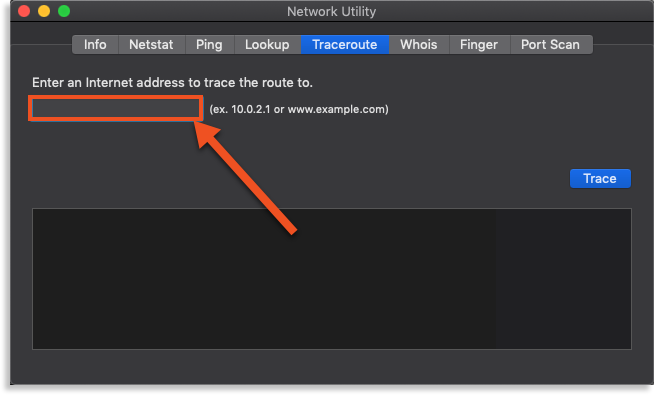
The process to run a traceroute on Mac will vary based on what OS version your Mac is using. MacOS Catalina and earlier use a built-in app called Network Utility. However, this app was deprecated in the MacOS Big Sur update.
Here are instructions for how to find which Mac operating system version you are using.
Select the version that your computer is currently running on in order to view its traceroute tutorial:
To run a traceroute using OS X Mavericks to MacOS Catalina, follow these steps: Open Finder


Unix
You can run a traceroute on a UNIX computer with the "traceroute" command. There are graphical traceroute tools available as well.
To run a traceroute using UNIX, please do the following:
- Open a terminal window
- Type traceroute and the IP address or website address
In the end, the command will look something like this:
traceroute [IP address or website address]
Traceroute Output
Here is the typical output of a traceroute, in this case from our network to the BBC website:
traceroute to www.bbc.net.uk (212.58.240.110), 64 hops max, 44 byte packets
1 baal.pair.net (192.168.1.8) 0.453 ms 0.287 ms 0.346 ms
2 sl-gw9-rly-6-0.sprintlink.net (144.232.248.125) 6.250 ms 5.888 ms 5.889 ms
3 sl-bb23-rly-3-0.sprintlink.net (144.232.14.37) 181.786 ms 207.330 ms 227.133 ms
4 sl-bb21-pen-12-0.sprintlink.net (144.232.20.33) 8.420 ms 8.548 ms 8.356 ms
5 sl-bb22-pen-15-0.sprintlink.net (144.232.16.30) 8.537 ms 8.384 ms 8.558 ms
6 sl-bb23-pen-15-0.sprintlink.net (144.232.8.177) 8.597 ms 8.593 ms 8.448 ms
7 sl-bb26-nyc-4-0.sprintlink.net (144.232.20.94) 12.680 ms 12.481 ms 12.589 ms
8 sl-gw9-nyc-9-0.sprintlink.net (144.232.7.98) 12.329 ms 12.294 ms 12.186 ms
9 sl-bbcte-1-0.sprintlink.net (160.81.111.198) 12.608 ms 12.545 ms 12.655 ms
10 www10.thny.bbc.co.uk (212.58.240.110) 12.019 ms 11.630 ms 12.051 ms
When a traceroute is sent out, your machine will send three probes out to scout the connection. To understand how the probes interact with the connection, you need to first understand how they travel.
Instead of going immediately to the destination, the probes will "hop" from one router/switch to another on it's way to the destination. It's like stopping at rest stops on a road trip.
When traceroute is run, each stop (router/switch) is shown, along with the time it took each probe to get there. The stop is recorded as an IP or web address, while each probe's time is shown in milliseconds next to it.
An asterisk indicates no response was received. This may or may not indicate a problem.
Many trace attempts will not reach the destination, due to the presence of a firewall or filter. Such traces will end with a series of asterisks or a filtered reply such as "!X".
How do I interpret the traceroute results?
The results must be interpreted very carefully; it is easy to jump to unwarranted conclusions. Having a trace in both directions is essential to avoiding several common misinterpretations.
If a single hop has unusually high response times, this is usually the sign of an overloaded router. However, an overloaded router does not necessarily mean slow transfer; modern routers rarely pass packets through their central processor.
If a single hop consists of nothing but asterisks, but the trace continues on after the asterisks, then this hop represents a router/switch that successfully routes traffic, but does not respond to traceroutes, or responds with a non-public IP address which your ISP filters. In particular, you may see this when tracing inbound to our network.
If dropped responses start to appear at a particular hop and continue through the remaining hops, this may indicate that a congested link is present at the first such hop. However, it may also indicate that the return path changes and that the problem actually lies in the return path.
If you have trouble interpreting your results, contact our support team. They will be happy to assist you.


